See business results at the top of your work desk
Managers can see repeat-purchase churn, first-contact speed, visit and lead conversion, and customer spend, with a salesperson breakdown.
Product update 2 min read
What changed
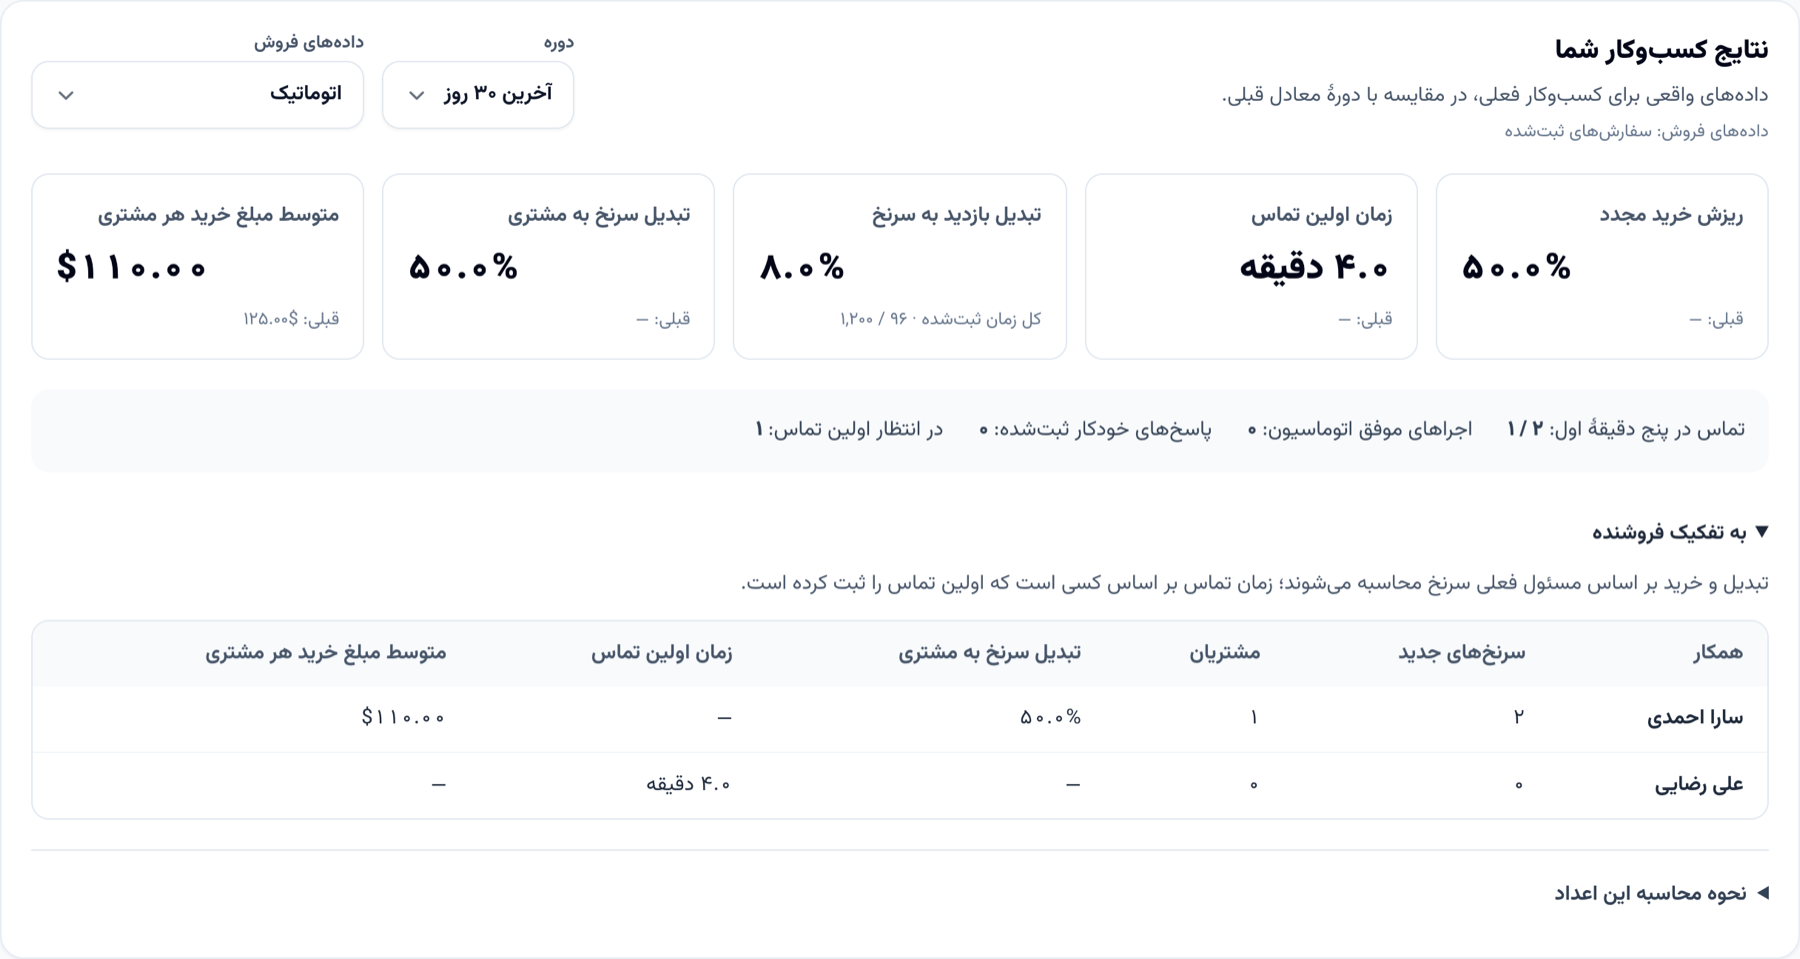
“Your business results” now appears at the top of the work desk and dashboard for business and sales managers. Five cards show repeat-purchase churn, time to first contact, visit-to-lead conversion, lead-to-customer conversion, and average spend per paying customer. Supporting counts show contacts within five minutes, leads awaiting contact, successful automation runs, and recorded automatic replies.
How to use it
- Open “Work desk” as a business or sales manager and choose the current business in the panel switcher.
- In “Your business results”, choose the last 7, 30, or 90 days and the sales source. Comparable cards include the preceding equal period.
- Read “By salesperson”; scroll the table horizontally on a phone.
- Open “How these numbers are calculated” for definitions, coverage limits, and the original response-time research.
Good to know
- Reports respect the current business and the reader’s lead visibility. Ordinary sales representatives do not receive this management report.
- Churn means previous-period buyers who did not purchase in this period. Visit conversion uses lifetime page views and submissions from forms and landing pages, not unique visitors in the selected period.
- Contact time runs from filing a lead here to its first logged call or chat. Uncontacted leads do not become zero-minute responses.
- Orders and invoices are separate selectable sources to prevent counting the same sale twice. Invoice refunds reduce sales. Conversion and spend follow the current lead owner; contact time follows the first caller.
- A dash means there is no denominator or measurement yet. A period-to-period change alone does not prove the system caused additional revenue. The screenshot uses demonstration data.